---
title: "Diagnosis and Management of TBD"
author: "Based on Franke, Ferrer & Patnaik — *Haematologica*, March 2026"
date: today
date-format: "MMMM DD, YYYY"
format:
html:
theme: flatly
highlight-style: kate
toc: true
toc-float: true
toc-depth: 3
toc-title: "Contents"
number-sections: false
css: tbd_style.css
include-in-header: tbd_header.html
code-fold: true
code-tools: true
fig-align: center
fig-dpi: 150
execute:
echo: false
warning: false
message: false
knitr:
opts_chunk:
fig.width: 8
fig.height: 5
---
```{r}
#| label: setup
#| include: false
library(ggplot2)
library(dplyr)
library(scales)
library(tidyr)
# Shared colour palette
pal <- c(
blue1 = "#1A5276", blue2 = "#2E86C1",
teal = "#148F77", green = "#27AE60",
orange = "#E67E22", red = "#C0392B",
grey = "#7F8C8D", light = "#D6EAF8"
)
# Shared ggplot2 theme
theme_tbd <- function(base_size = 11) {
theme_minimal(base_size = base_size) +
theme(
plot.title = element_text(face = "bold", size = base_size + 2,
colour = pal["blue1"]),
plot.subtitle = element_text(colour = pal["grey"], size = base_size - 1),
panel.grid.minor = element_blank(),
panel.grid.major = element_line(colour = "#ECF0F1"),
plot.background = element_rect(fill = "white", colour = NA),
panel.background = element_rect(fill = "white", colour = NA),
legend.position = "bottom"
)
}
```
<!-- ══════════════════════════════════════════════ -->
<!-- HERO BANNER -->
<!-- ══════════════════════════════════════════════ -->
<div class="hero-banner">
<div class="hero-icon">🧬</div>
<h1 class="hero-title">Telomere Biology Disorders</h1>
<p class="hero-sub">A comprehensive visual review of diagnosis, manifestations, and emerging therapies</p>
<div class="hero-pills">
<span class="pill pill-blue">Short Telomere Syndromes</span>
<span class="pill pill-teal">Clonal Hematopoiesis</span>
<span class="pill pill-green">Novel Therapeutics</span>
</div>
</div>
---
# Overview {.section-header}
::: {.callout-note appearance="minimal"}
**Telomere Biology Disorders (TBD)** are a heterogeneous group of inherited conditions
characterised by impaired telomere maintenance. The clinical spectrum spans bone marrow
failure, pulmonary fibrosis, liver disease, and cancer predisposition — making timely
diagnosis and multidisciplinary management essential.
:::
## Key Definitions
<div class="card-grid">
<div class="def-card">
<div class="def-icon" style="background:#D6EAF8;color:#1A5276;">📏</div>
<h4>Telomere Biology Disorders (TBD)</h4>
<p>Syndromes characterised by <strong>critically short telomeres</strong> leading to accelerated
ageing, bone marrow failure, pulmonary fibrosis, and malignancy.</p>
</div>
<div class="def-card">
<div class="def-icon" style="background:#D5F5E3;color:#1E8449;">🔬</div>
<h4>Cancer Predisposition with Long Telomeres (CPLT)</h4>
<p>Distinct from TBD — variants causing <strong>abnormally elongated telomeres</strong> enabling
uncontrolled cellular proliferation and elevated cancer risk.</p>
</div>
<div class="def-card">
<div class="def-icon" style="background:#FDEBD0;color:#A04000;">⚡</div>
<h4>Clonal Hematopoiesis (CH)</h4>
<p>Clonal expansion of HSPCs via somatic mutations conferring a <strong>fitness advantage</strong>
under bone marrow stress from progressive telomere shortening.</p>
</div>
<div class="def-card">
<div class="def-icon" style="background:#FDEDEC;color:#922B21;">🔄</div>
<h4>Genetic Anticipation</h4>
<p>Successive generations present with <strong>shorter baseline telomere lengths</strong>, causing
earlier onset and increased severity of TBD manifestations.</p>
</div>
</div>
---
# The Telomere Apparatus {.section-header}
## Telomere Physiology Across the Lifespan
```{r}
#| label: fig-lifespan
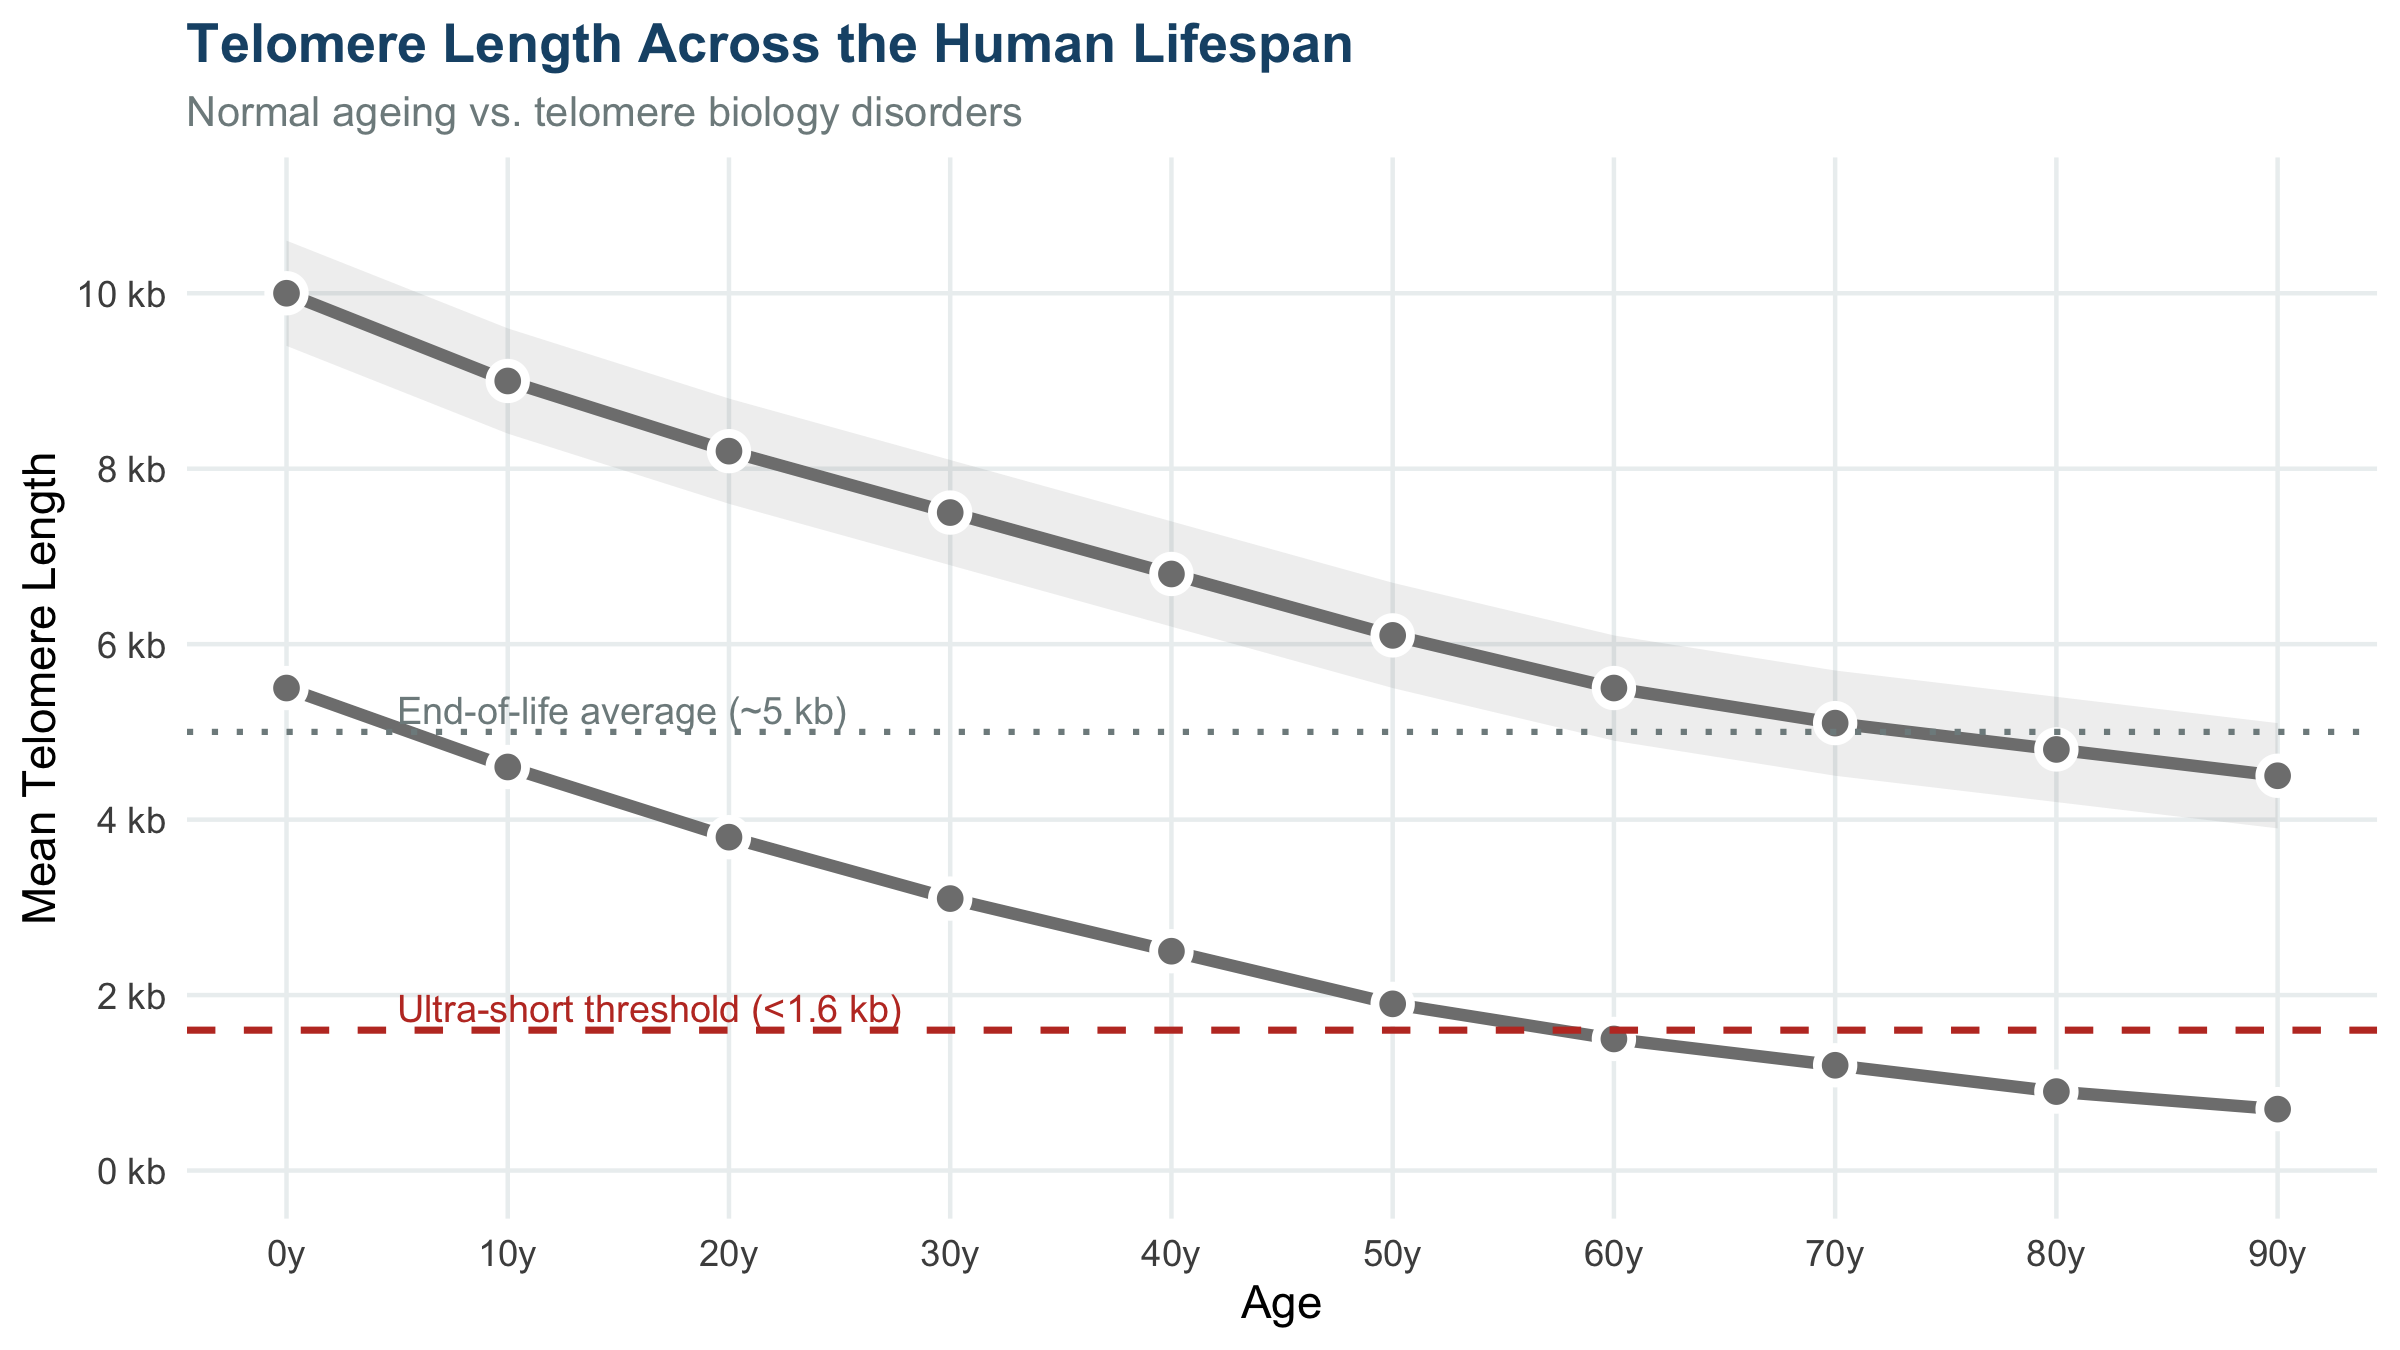
#| fig-cap: "Telomere length dynamics across the human lifespan. Ultra-short telomeres (<1.6 kb) accumulate with age and drive cellular senescence."
#| fig-height: 4.5
age_data <- tibble(
age = c(0, 10, 20, 30, 40, 50, 60, 70, 80, 90),
normal = c(10.0, 9.0, 8.2, 7.5, 6.8, 6.1, 5.5, 5.1, 4.8, 4.5),
tbd = c(5.5, 4.6, 3.8, 3.1, 2.5, 1.9, 1.5, 1.2, 0.9, 0.7)
)
age_long <- age_data |>
pivot_longer(c(normal, tbd), names_to = "group", values_to = "tl_kb") |>
mutate(group = recode(group,
normal = "Normal ageing",
tbd = "TBD / Short telomere syndrome"
))
ggplot(age_long, aes(x = age, y = tl_kb, colour = group, fill = group)) +
geom_ribbon(
data = filter(age_long, group == "Normal ageing"),
aes(ymin = tl_kb - 0.6, ymax = tl_kb + 0.6),
alpha = 0.12, colour = NA
) +
geom_line(linewidth = 1.4) +
geom_point(size = 3, shape = 21, colour = "white", stroke = 1.5) +
geom_hline(yintercept = 1.6, linetype = "dashed",
colour = pal["red"], linewidth = 0.8) +
annotate("text", x = 5, y = 1.85,
label = "Ultra-short threshold (<1.6 kb)",
colour = pal["red"], size = 3.2, hjust = 0) +
geom_hline(yintercept = 5.0, linetype = "dotted",
colour = pal["grey"], linewidth = 0.7) +
annotate("text", x = 5, y = 5.25,
label = "End-of-life average (~5 kb)",
colour = pal["grey"], size = 3.2, hjust = 0) +
scale_colour_manual(values = c(
"Normal ageing" = pal["blue2"],
"TBD / Short telomere syndrome" = pal["red"]
)) +
scale_fill_manual(values = c(
"Normal ageing" = pal["blue2"],
"TBD / Short telomere syndrome" = pal["red"]
)) +
scale_x_continuous(breaks = seq(0, 90, 10),
labels = paste0(seq(0, 90, 10), "y")) +
scale_y_continuous(limits = c(0, 11), breaks = seq(0, 10, 2),
labels = paste0(seq(0, 10, 2), " kb")) +
labs(
title = "Telomere Length Across the Human Lifespan",
subtitle = "Normal ageing vs. telomere biology disorders",
x = "Age", y = "Mean Telomere Length",
colour = NULL, fill = NULL
) +
theme_tbd()
```
## Key Molecular Components
```{r}
#| label: tbl-components
#| tbl-cap: "Core components of the telomere apparatus and TBD gene associations"
components <- tibble(
Complex = c(rep("Telomerase", 6), rep("Shelterin", 4), rep("CST", 3), rep("Other", 3)),
Component = c("TERT","TERC","DKC1 (Dyskerin)","NOP10","NHP2","PARN",
"TIN2 (TINF2)","TPP1 (ACD)","POT1","RAP1",
"CTC1","STN1","TEN1",
"RTEL1","RPA1","ZCCHC8"),
Role = c(
"Catalytic reverse transcriptase subunit",
"RNA template for telomere synthesis",
"Stabilises TERC; telomerase assembly",
"Telomerase assembly", "Telomerase assembly",
"Controls hTR levels; aids maturation",
"Core scaffold; anchors TRF1/TRF2/TPP1",
"Docks telomerase to telomere",
"Binds single-stranded 3′ overhang",
"Binds TRF2; chromosome-end protection",
"C-strand fill-in; halts overextension",
"C-strand fill-in", "C-strand fill-in",
"Unwinds G-quadruplexes; T-loop resolution",
"Stabilises single-stranded telomeric DNA",
"hTR maturation"
),
`TBD Gene` = c("✓","✓","✓","✓","✓","✓",
"✓","✓","✓","–",
"✓","✓","–",
"✓","✓","✓")
)
knitr::kable(components, align = c("l","l","l","c"))
```
---
# Diagnostic Landscape {.section-header}
## Telomere Length Measurement Methods
```{r}
#| label: fig-methods
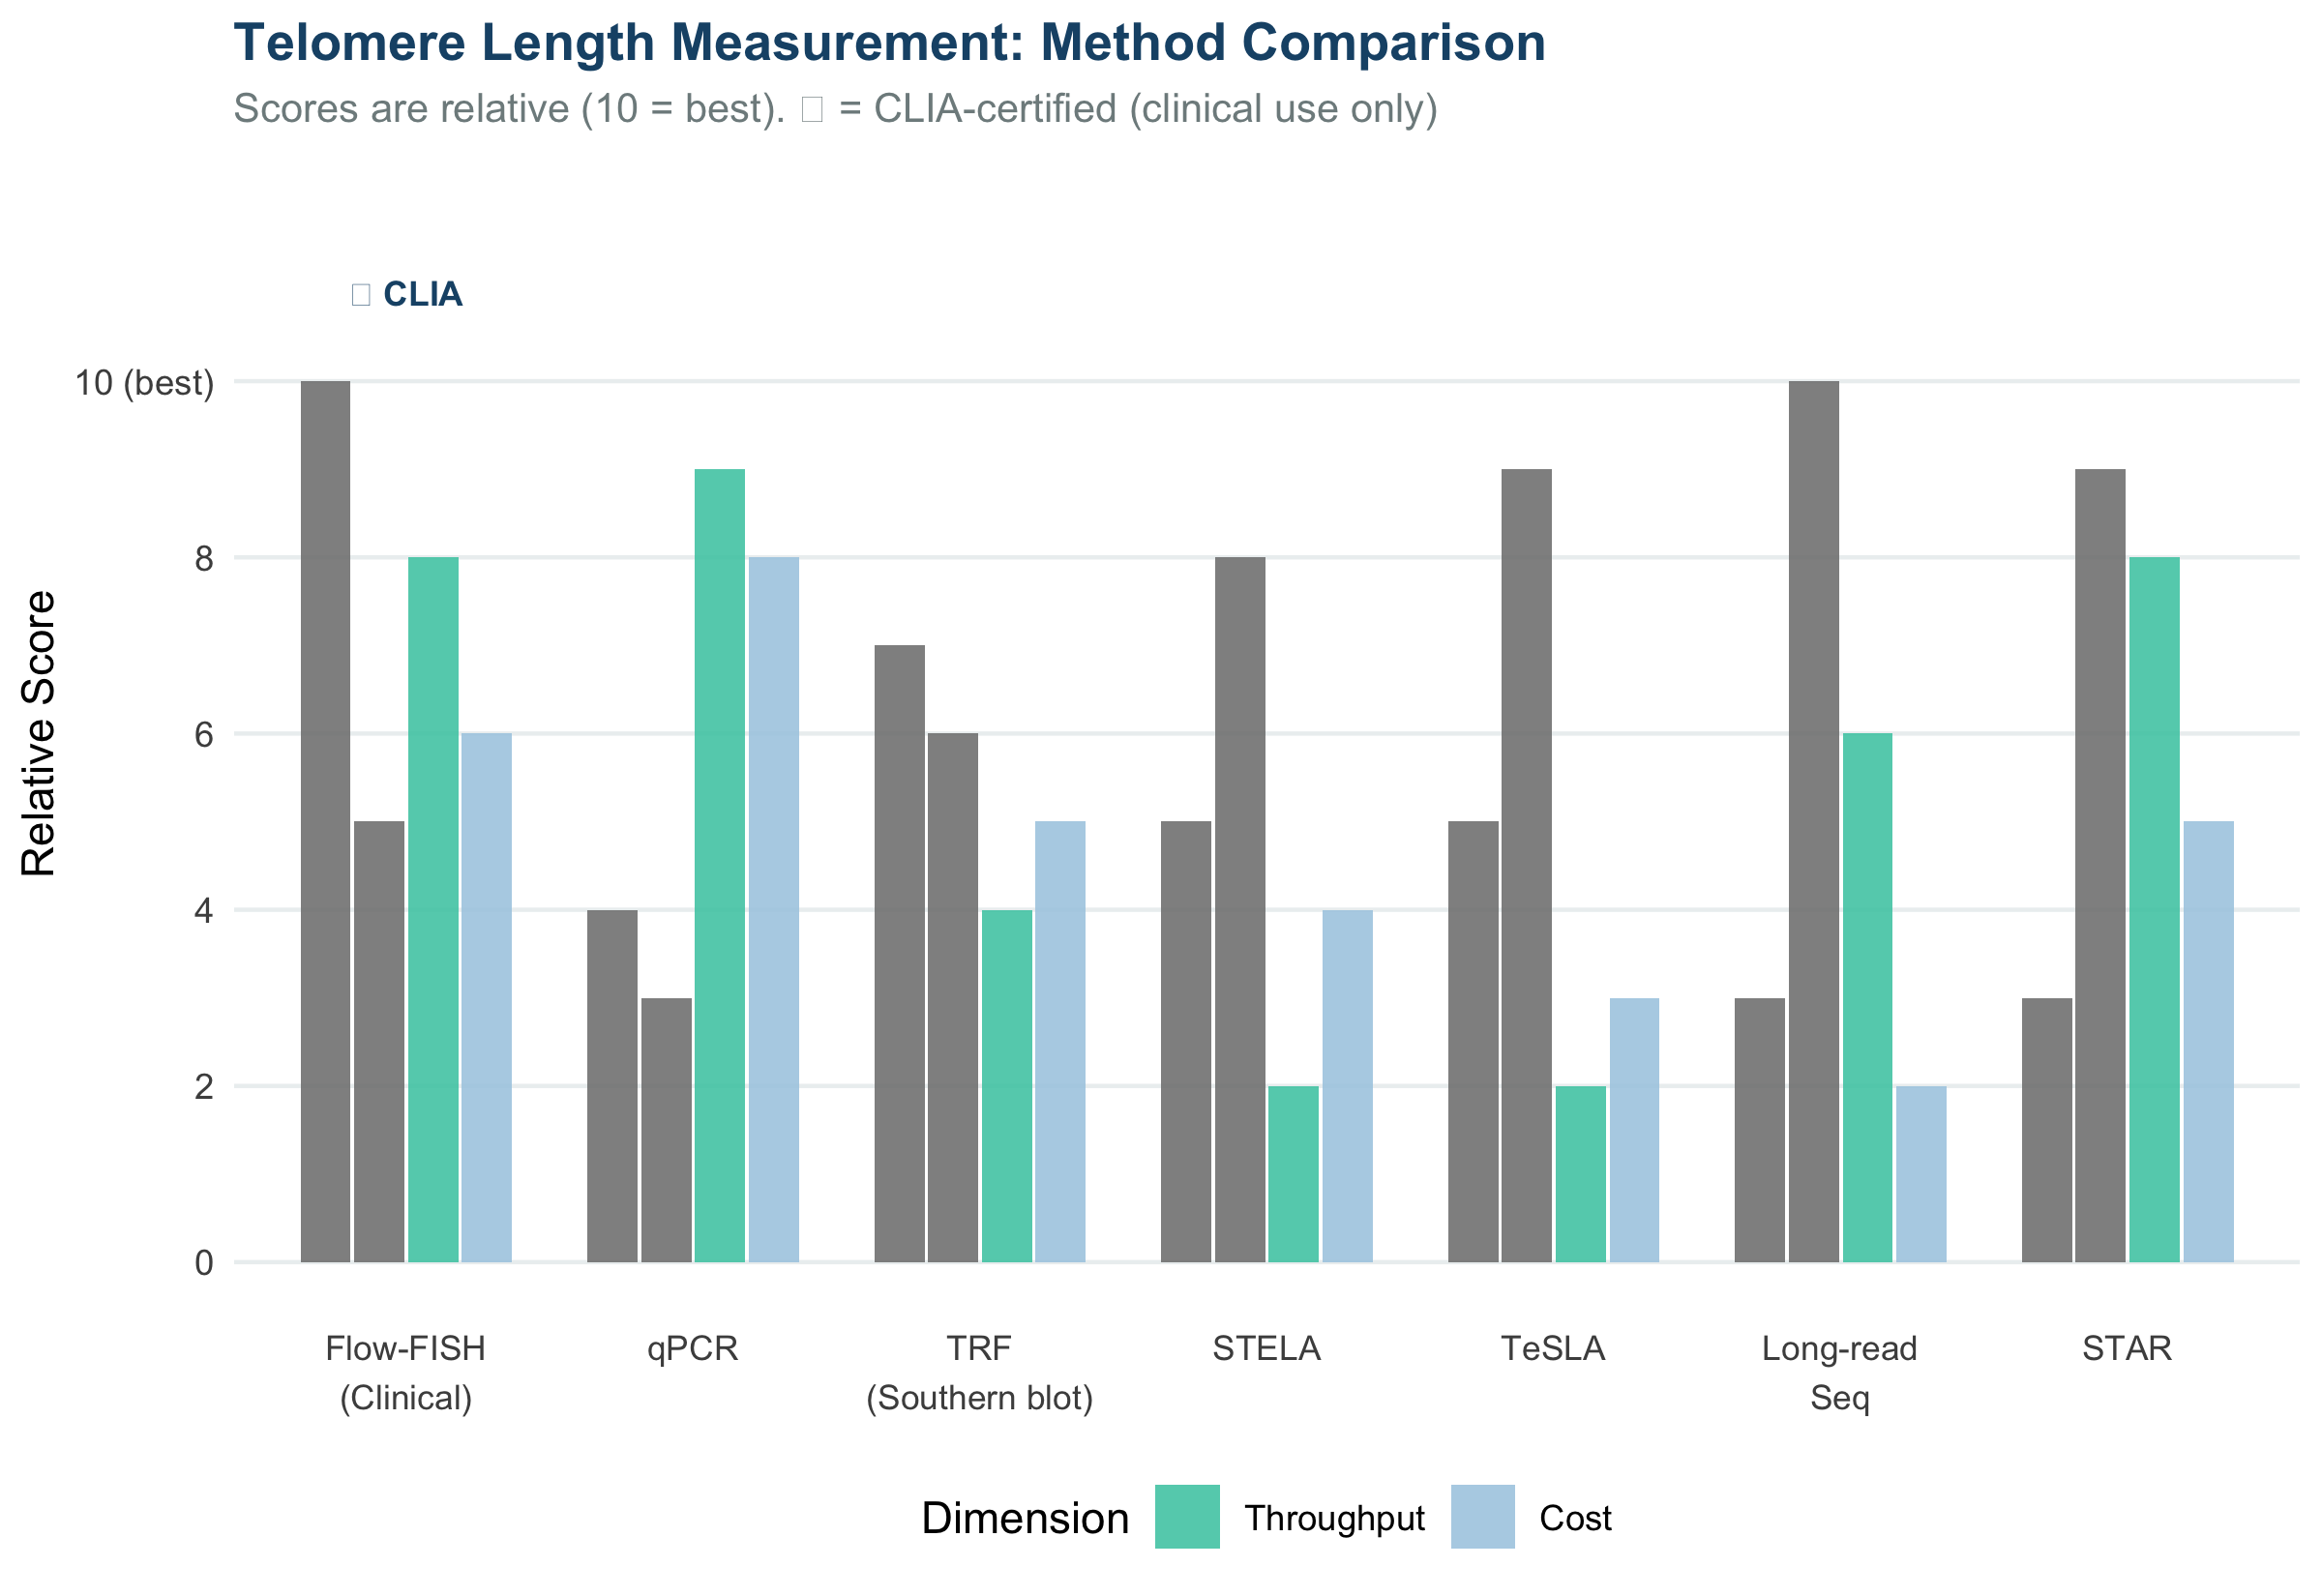
#| fig-cap: "Relative comparison of TL measurement methods across key dimensions (10 = best). ★ = CLIA-certified for clinical use."
#| fig-height: 5.5
methods <- tibble(
Method = c("Flow-FISH\n(Clinical)","qPCR","TRF\n(Southern blot)",
"STELA","TeSLA","Long-read\nSeq","STAR"),
Throughput = c(8, 9, 4, 2, 2, 6, 8),
Resolution = c(5, 3, 6, 8, 9, 10, 9),
Cost = c(6, 8, 5, 4, 3, 2, 5),
Validated = c(10, 4, 7, 5, 5, 3, 3),
CLIA = c(TRUE, FALSE, FALSE, FALSE, FALSE, FALSE, FALSE)
)
methods_long <- methods |>
pivot_longer(c(Throughput, Resolution, Cost, Validated),
names_to = "Dim", values_to = "Score") |>
mutate(
Method = factor(Method, levels = methods$Method),
Dim = factor(Dim, levels = c("Validated","Resolution","Throughput","Cost"))
)
ggplot(methods_long, aes(x = Method, y = Score, fill = Dim)) +
geom_col(position = position_dodge(0.75), width = 0.7, alpha = 0.88) +
geom_text(
data = filter(methods, CLIA),
aes(x = Method, y = 11, label = "★ CLIA"),
inherit.aes = FALSE,
colour = pal["blue1"], fontface = "bold", size = 3
) +
scale_fill_manual(values = c(
Validated = pal["blue1"],
Resolution = pal["blue2"],
Throughput = "#48C9B0",
Cost = "#A9CCE3"
)) +
scale_y_continuous(limits = c(0, 12), breaks = seq(0, 10, 2),
labels = c("0","2","4","6","8","10 (best)")) +
labs(
title = "Telomere Length Measurement: Method Comparison",
subtitle = "Scores are relative (10 = best). ★ = CLIA-certified (clinical use only)",
x = NULL, y = "Relative Score", fill = "Dimension"
) +
theme_tbd() +
theme(
panel.grid.major.x = element_blank(),
axis.text.x = element_text(size = 8.5, lineheight = 1.2)
)
```
::: {.callout-tip appearance="minimal"}
**Clinical Pearl:** Flow-FISH is the only CLIA-validated assay, with 80% sensitivity and
85% specificity for TL <10th percentile. Approximately **20–40%** of adult TBD patients
will have no identifiable germline pathogenic variant.
:::
---
# Genetic Architecture {.section-header}
## TBD Gene Landscape by Molecular Complex
```{r}
#| label: fig-genes
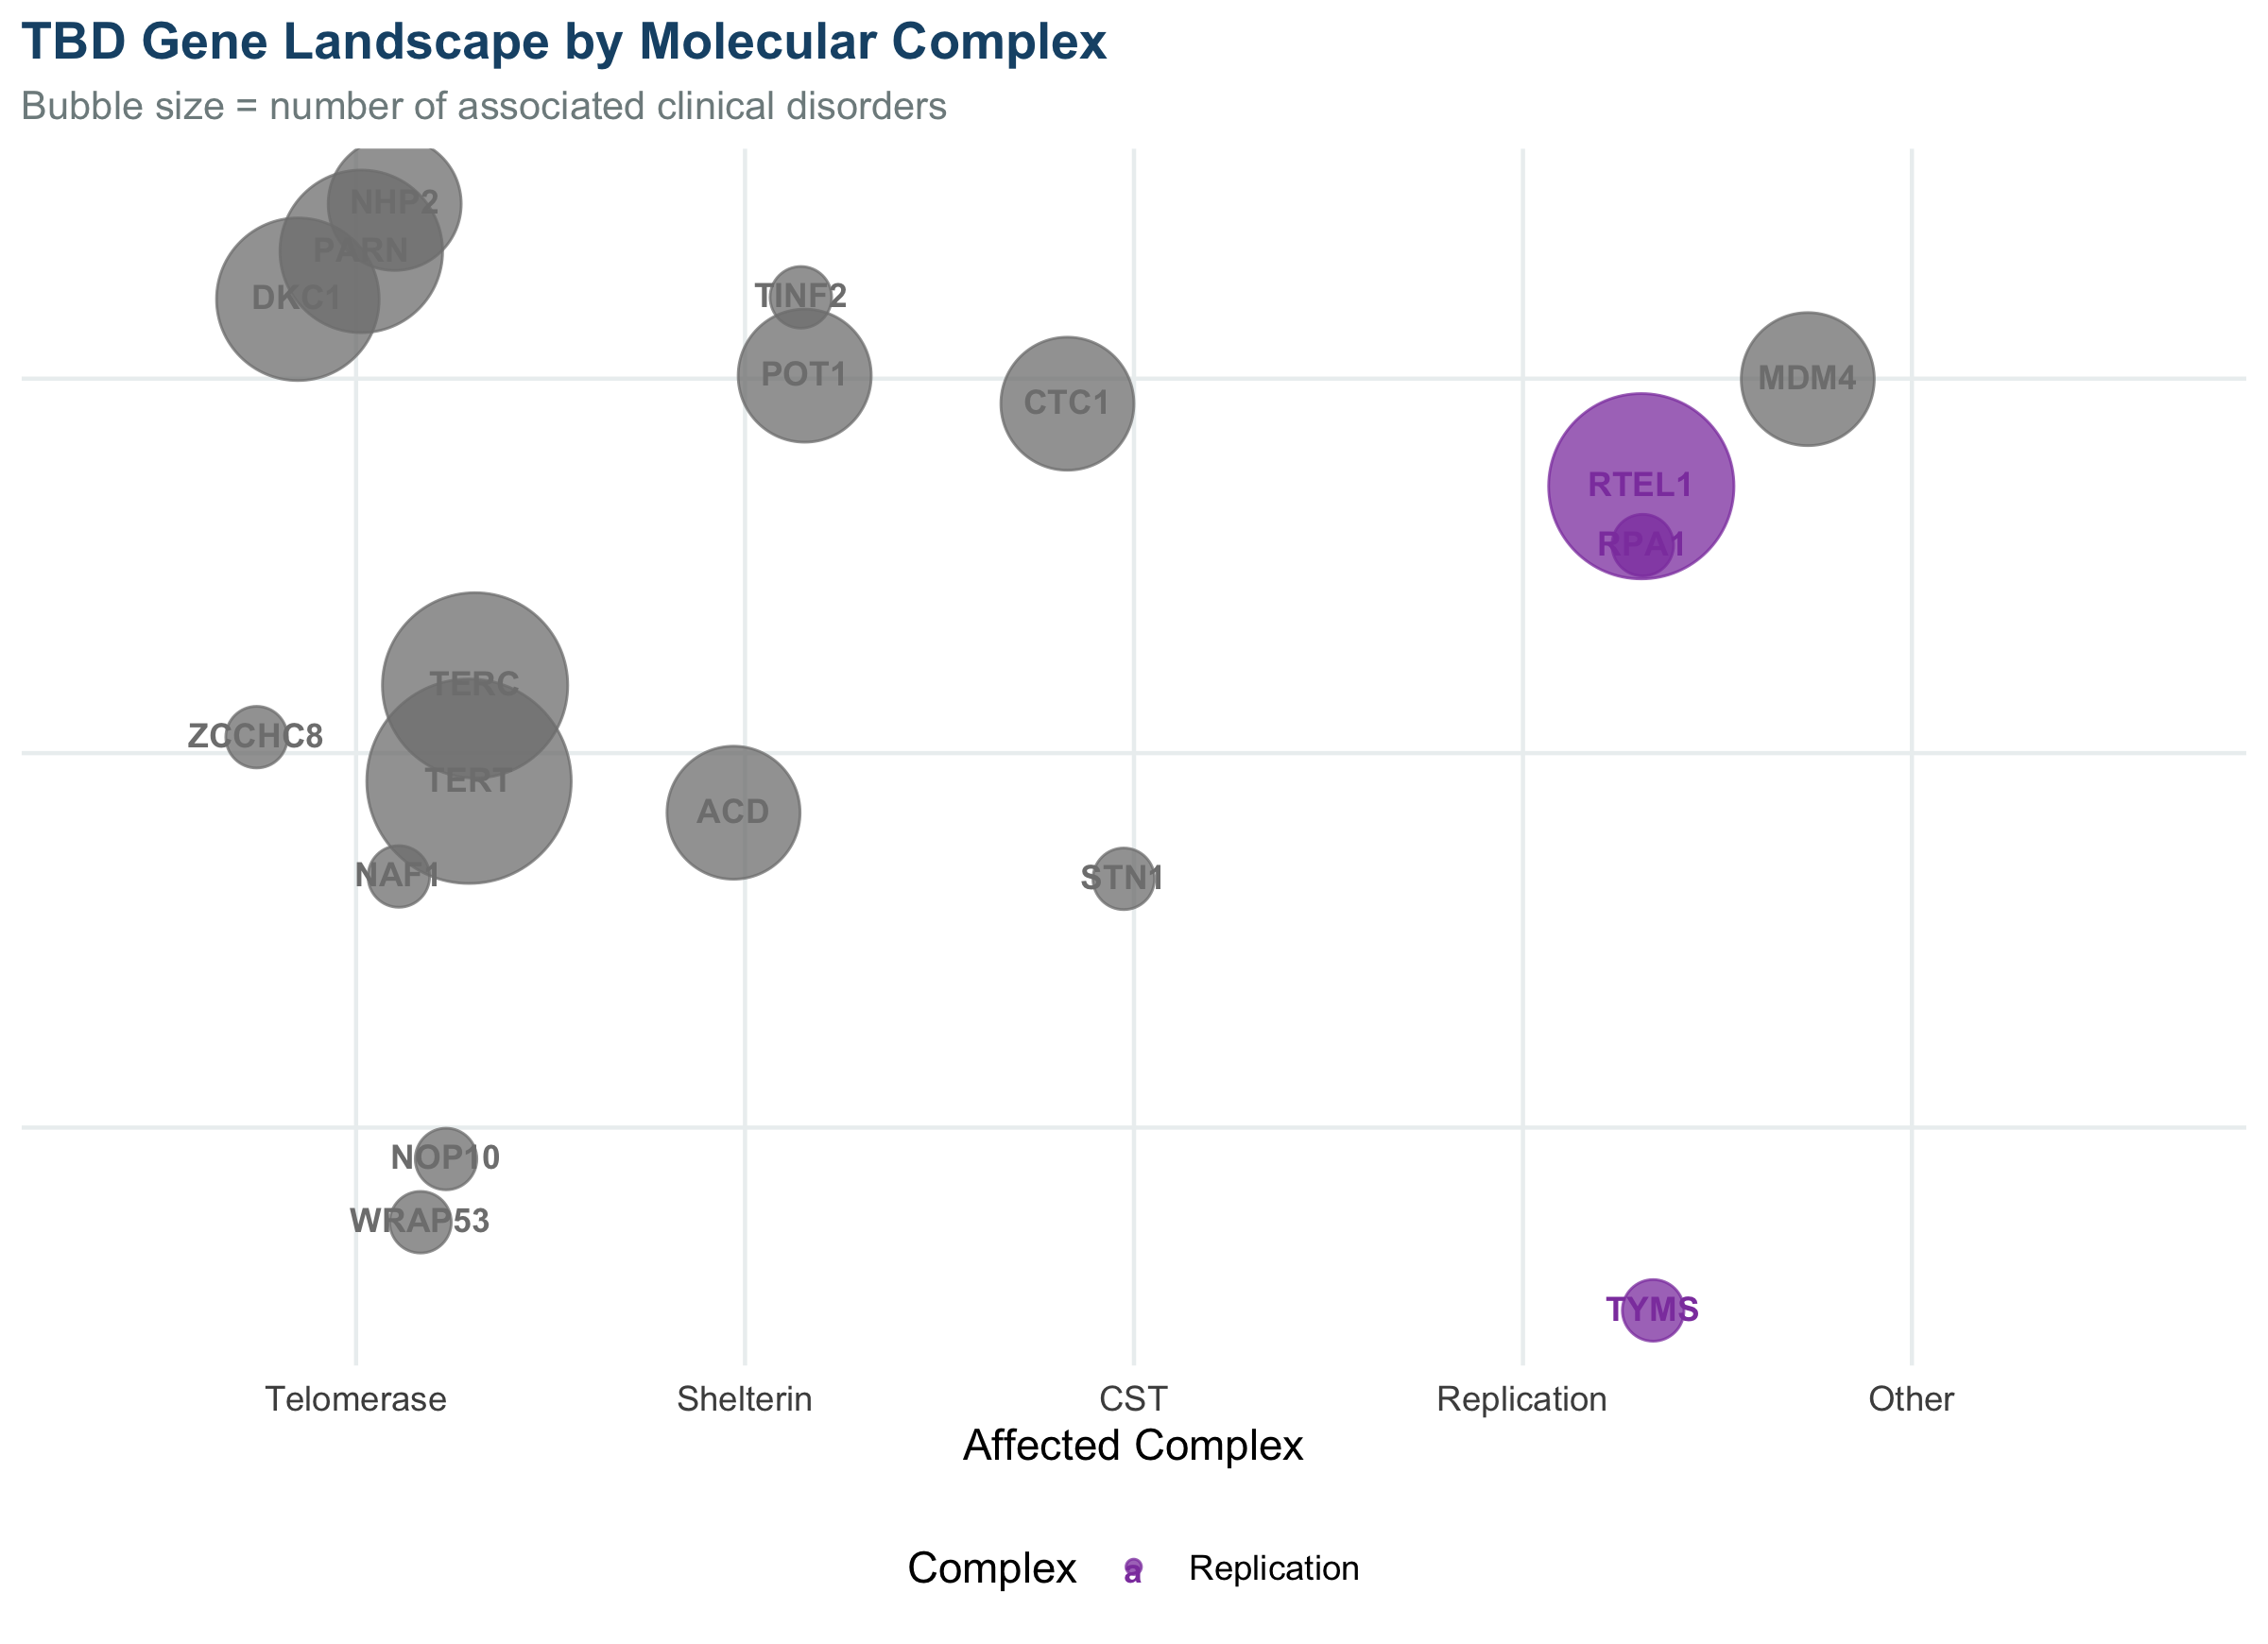
#| fig-cap: "TBD-associated genes by affected complex. Bubble size reflects the number of associated clinical disorders."
#| fig-height: 5.8
genes <- tibble(
Gene = c("TERT","TERC","DKC1","NOP10","NHP2","PARN","WRAP53",
"ZCCHC8","NAF1","TINF2","ACD","POT1","RTEL1",
"CTC1","STN1","RPA1","TYMS","MDM4"),
Complex = c(rep("Telomerase", 9), rep("Shelterin", 3),
rep("Replication", 1), rep("CST", 2),
rep("Replication", 2), "Other"),
Disorders = c(5, 4, 3, 1, 2, 3, 1, 1, 1, 1, 2, 2, 4, 2, 1, 1, 1, 2)
)
complex_cols <- c(
Telomerase = pal["blue1"],
Shelterin = pal["teal"],
CST = pal["orange"],
Replication = "#8E44AD",
Other = pal["grey"]
)
set.seed(42)
genes <- genes |>
mutate(
x = as.numeric(factor(Complex,
levels = c("Telomerase","Shelterin","CST","Replication","Other"))) +
runif(n(), -0.35, 0.35),
y = runif(n(), 0.5, 3.5)
)
ggplot(genes, aes(x = x, y = y)) +
geom_point(aes(size = Disorders * 2 + 4, colour = Complex), alpha = 0.75) +
geom_text(aes(label = Gene, colour = Complex),
size = 3, fontface = "bold", vjust = 0.4) +
scale_size_continuous(range = c(7, 24), guide = "none") +
scale_colour_manual(values = complex_cols) +
scale_x_continuous(
breaks = 1:5,
labels = c("Telomerase","Shelterin","CST","Replication","Other"),
limits = c(0.4, 5.6)
) +
labs(
title = "TBD Gene Landscape by Molecular Complex",
subtitle = "Bubble size = number of associated clinical disorders",
x = "Affected Complex", y = NULL, colour = "Complex"
) +
theme_tbd() +
theme(axis.text.y = element_blank(), panel.grid = element_blank())
```
---
# Cancer Risk {.section-header}
## Observed / Expected Malignancy Ratios in TBD
```{r}
#| label: fig-cancer
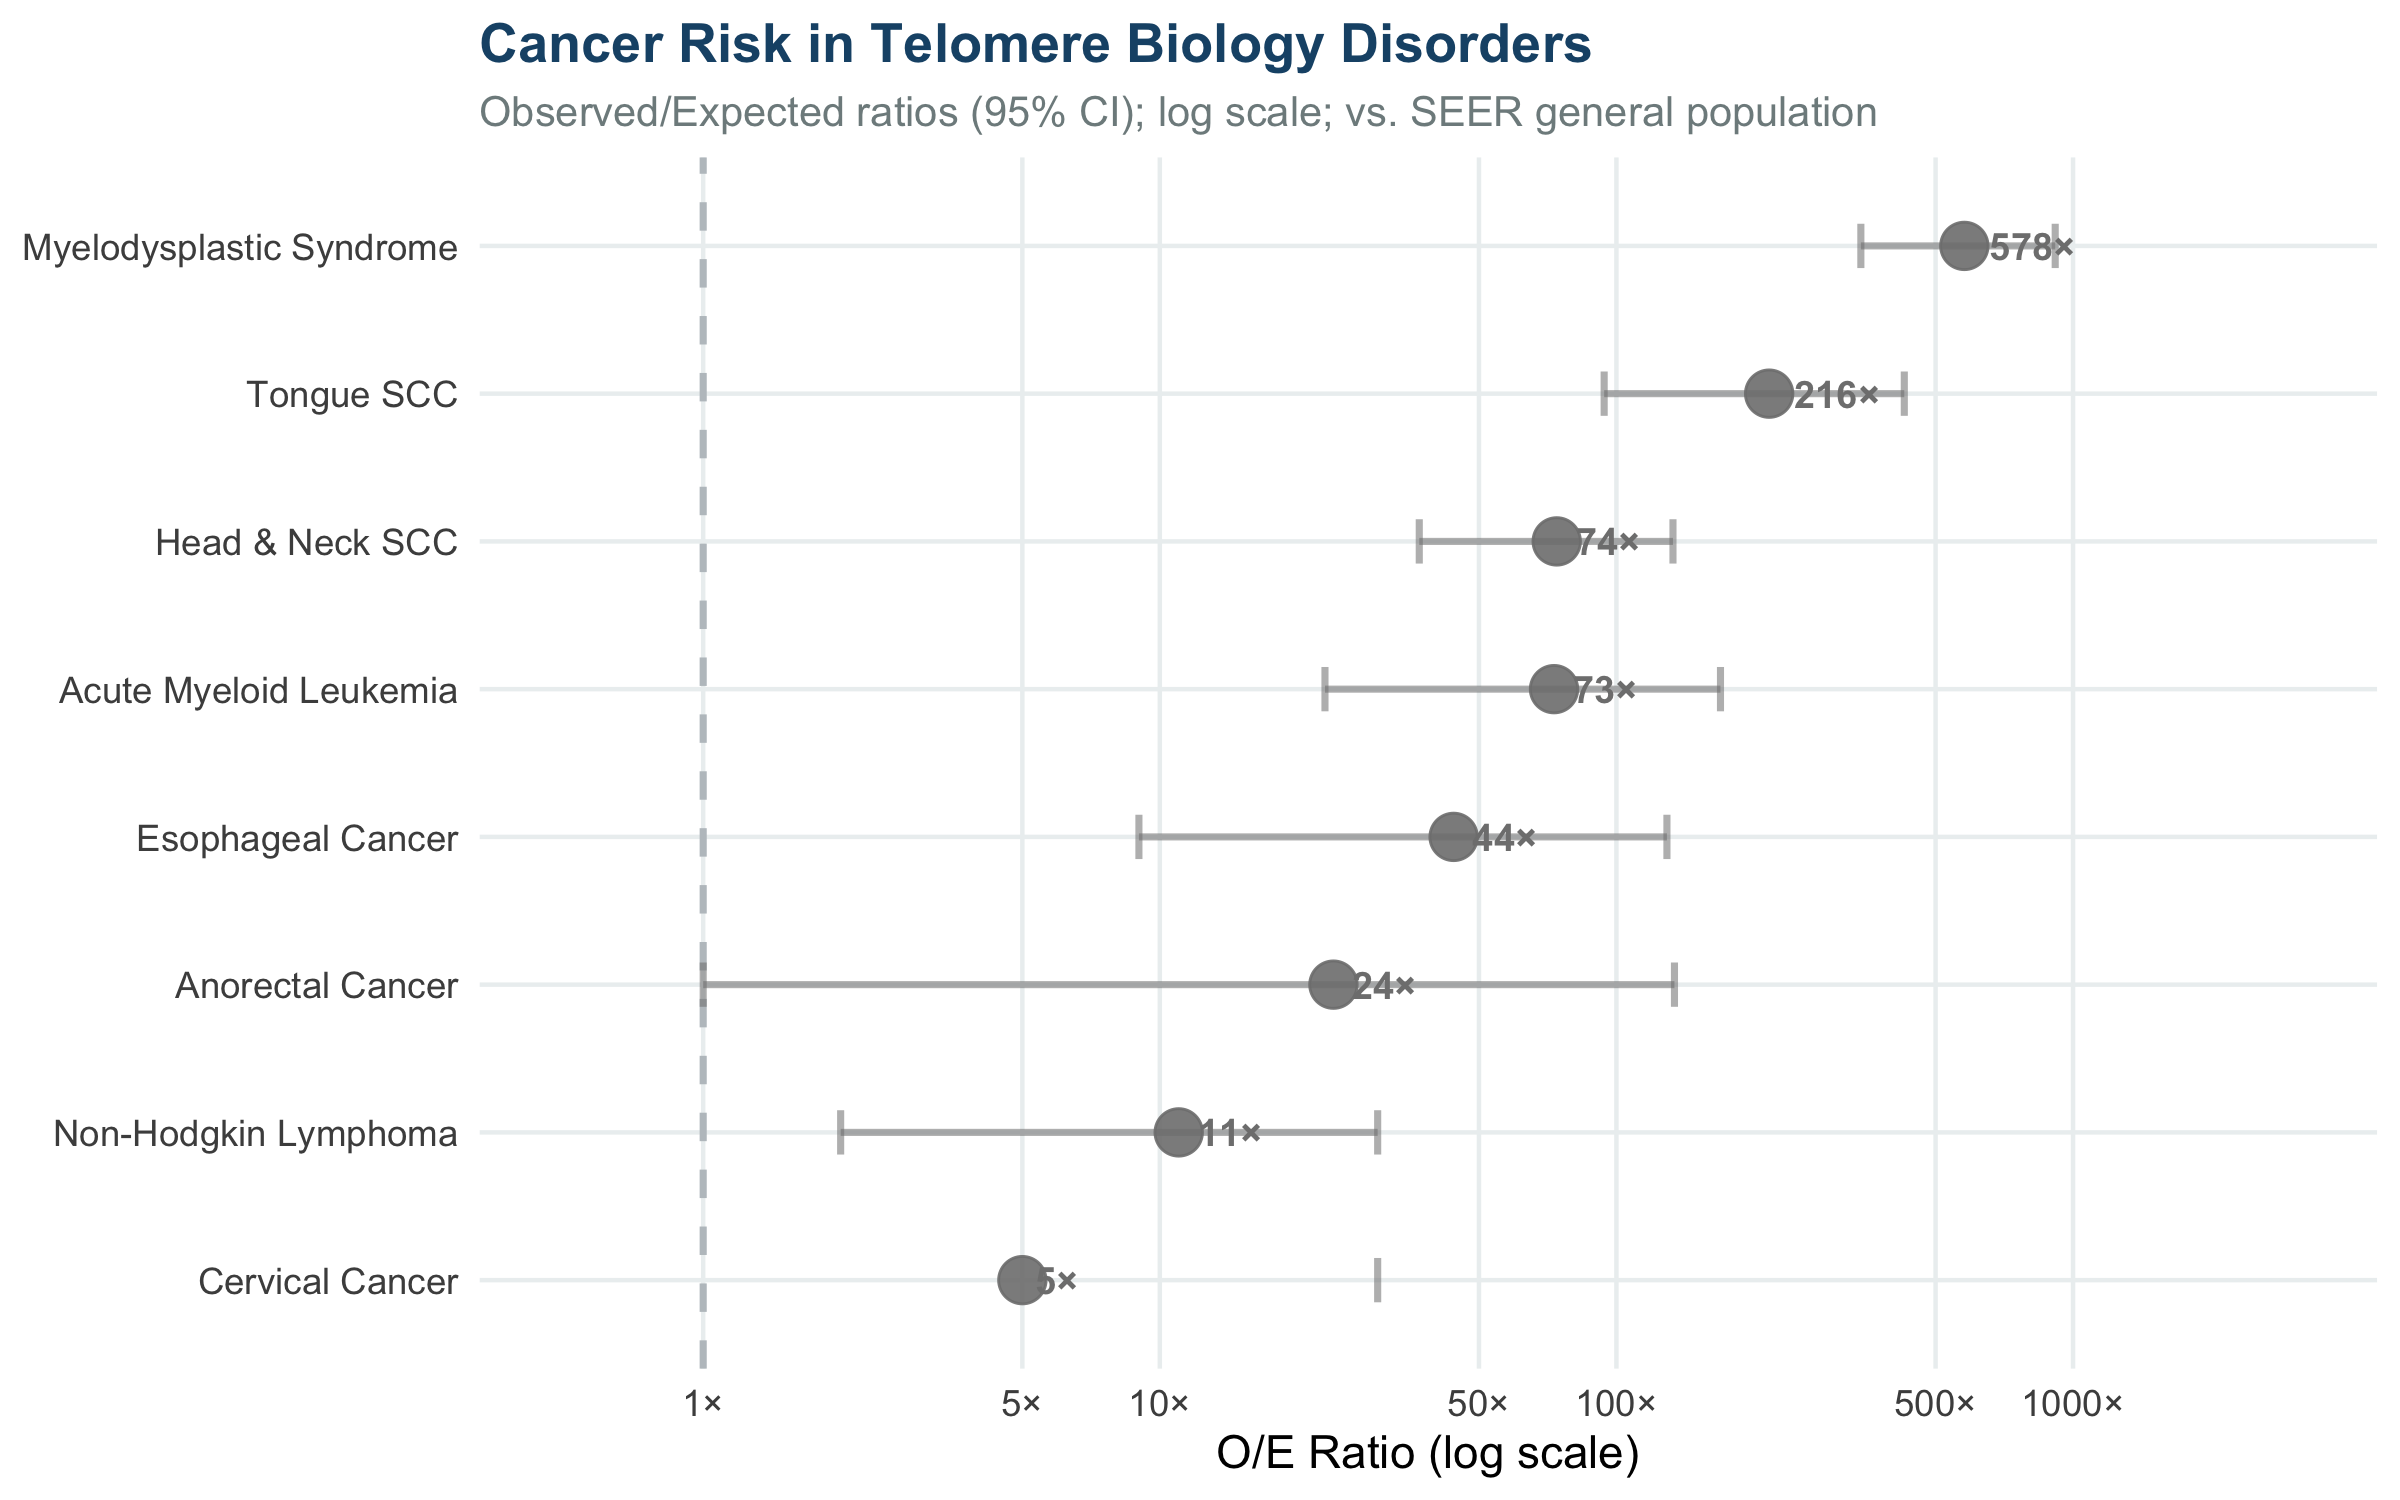
#| fig-cap: "Observed/Expected cancer ratios in TBD cohorts (95% CI shown). Note the log scale — MDS and tongue SCC carry dramatically elevated risks."
#| fig-height: 5
cancer <- tibble(
Cancer = c("Myelodysplastic Syndrome","Tongue SCC",
"Head & Neck SCC","Acute Myeloid Leukemia",
"Esophageal Cancer","Anorectal Cancer",
"Non-Hodgkin Lymphoma","Cervical Cancer"),
OE = c(578, 216, 74, 73, 44, 24, 11, 5),
CI_lo = c(343, 94, 37, 23, 9, 1, 2, 0.1),
CI_hi = c(914, 427, 133, 169, 129, 134, 30, 30),
Type = c("Hematologic","Solid","Solid","Hematologic",
"Solid","Solid","Hematologic","Solid")
) |>
mutate(Cancer = factor(Cancer, levels = rev(Cancer)))
type_cols <- c(Hematologic = pal["blue1"], Solid = pal["orange"])
ggplot(cancer, aes(y = Cancer, x = OE, colour = Type)) +
geom_vline(xintercept = 1, linetype = "dashed",
colour = "#BDC3C7", linewidth = 0.8) +
geom_errorbarh(aes(xmin = CI_lo, xmax = CI_hi),
height = 0.3, linewidth = 0.8, alpha = 0.55) +
geom_point(size = 5, alpha = 0.9) +
geom_text(aes(label = paste0(OE, "×")),
hjust = -0.3, size = 3.2, fontface = "bold") +
scale_x_log10(
breaks = c(1, 5, 10, 50, 100, 500, 1000),
labels = c("1×","5×","10×","50×","100×","500×","1000×"),
limits = c(0.5, 3000)
) +
scale_colour_manual(values = type_cols) +
labs(
title = "Cancer Risk in Telomere Biology Disorders",
subtitle = "Observed/Expected ratios (95% CI); log scale; vs. SEER general population",
x = "O/E Ratio (log scale)", y = NULL, colour = "Cancer Type"
) +
theme_tbd() +
theme(
panel.grid.major.y = element_line(colour = "#ECF0F1"),
legend.position = "top"
)
```
::: {.callout-warning appearance="minimal"}
**Cancer Surveillance:** TBD patients face an estimated **3-fold higher overall cancer risk**
vs. the general population. MDS risk may exceed **578×** expected rates in dyskeratosis
congenita cohorts. Autosomal recessive and X-linked inheritance patterns carry the most
pronounced risk.
:::
---
# Clonal Hematopoiesis in TBD {.section-header}
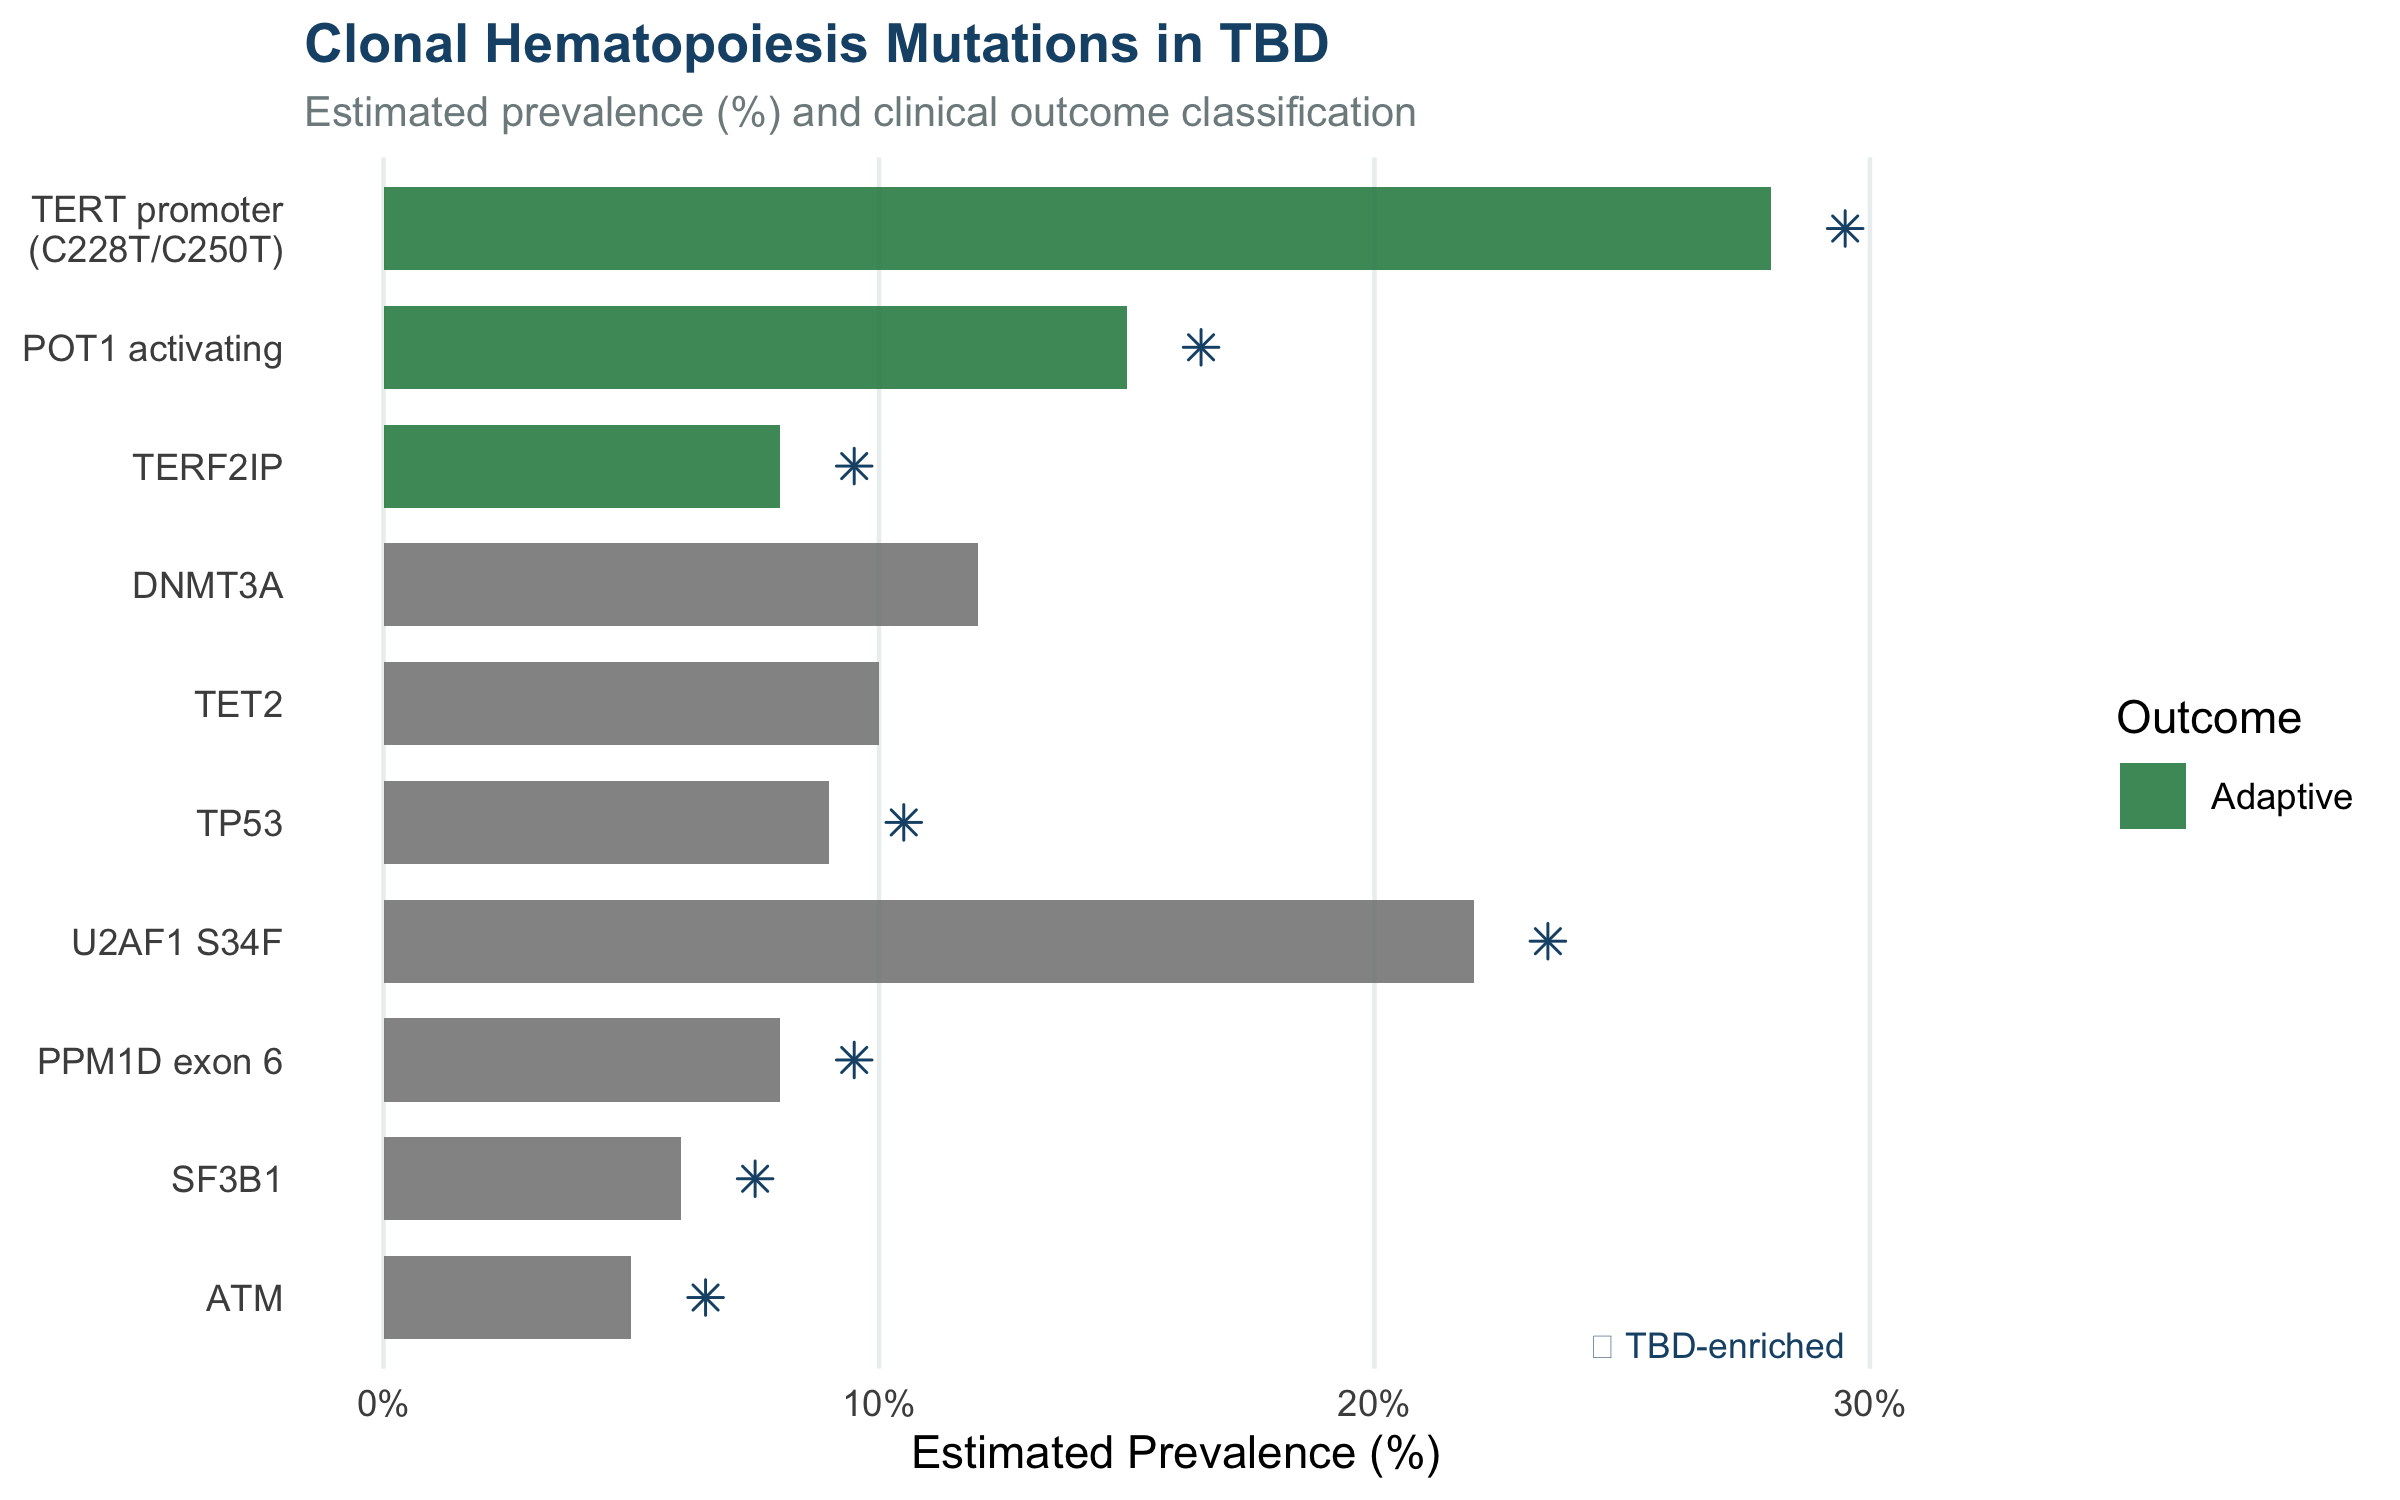
Critically short telomeres impose unique fitness constraints on HSPCs, driving a CH
landscape that differs markedly from age-related CH. Somatic mutations can be either
**adaptive** (restoring telomere function) or **maladaptive** (risking haematologic malignancy).
```{r}
#| label: fig-ch
#| fig-cap: "CH mutation types in TBD classified by functional outcome. Adaptive mutations attempt to restore telomere function; maladaptive mutations risk progression to MDS/AML."
#| fig-height: 5
ch <- tibble(
Mutation = c("TERT promoter\n(C228T/C250T)","POT1 activating","TERF2IP",
"DNMT3A","TET2","TP53",
"U2AF1 S34F","PPM1D exon 6","SF3B1","ATM"),
Outcome = c("Adaptive","Adaptive","Adaptive",
"Age-related CH","Age-related CH","Maladaptive",
"Maladaptive","Potentially maladaptive",
"Maladaptive","Potentially maladaptive"),
Freq = c(28, 15, 8, 12, 10, 9, 22, 8, 6, 5),
TBD_specific = c(TRUE, TRUE, TRUE, FALSE, FALSE, TRUE, TRUE, TRUE, TRUE, TRUE)
) |>
mutate(
Outcome = factor(Outcome,
levels = c("Adaptive","Age-related CH",
"Potentially maladaptive","Maladaptive")),
Mutation = factor(Mutation, levels = rev(Mutation))
)
outcome_pal <- c(
Adaptive = "#1E8449",
`Age-related CH` = pal["blue2"],
`Potentially maladaptive` = pal["orange"],
Maladaptive = pal["red"]
)
ggplot(ch, aes(y = Mutation, x = Freq, fill = Outcome)) +
geom_col(alpha = 0.85, width = 0.7) +
geom_point(
data = filter(ch, TBD_specific),
aes(x = Freq + 1.5, y = Mutation),
shape = 8, size = 2.5, colour = pal["blue1"], inherit.aes = FALSE
) +
annotate("text", x = 29.5, y = 0.6,
label = "★ TBD-enriched", size = 3, colour = pal["blue1"], hjust = 1) +
scale_fill_manual(values = outcome_pal) +
scale_x_continuous(labels = function(x) paste0(x, "%"), limits = c(0, 32)) +
labs(
title = "Clonal Hematopoiesis Mutations in TBD",
subtitle = "Estimated prevalence (%) and clinical outcome classification",
x = "Estimated Prevalence (%)", y = NULL, fill = "Outcome"
) +
theme_tbd() +
theme(
panel.grid.major.y = element_blank(),
panel.grid.major.x = element_line(colour = "#ECF0F1"),
legend.position = "right"
)
```
---
# Transplantation Outcomes {.section-header}
```{r}
#| label: fig-transplant
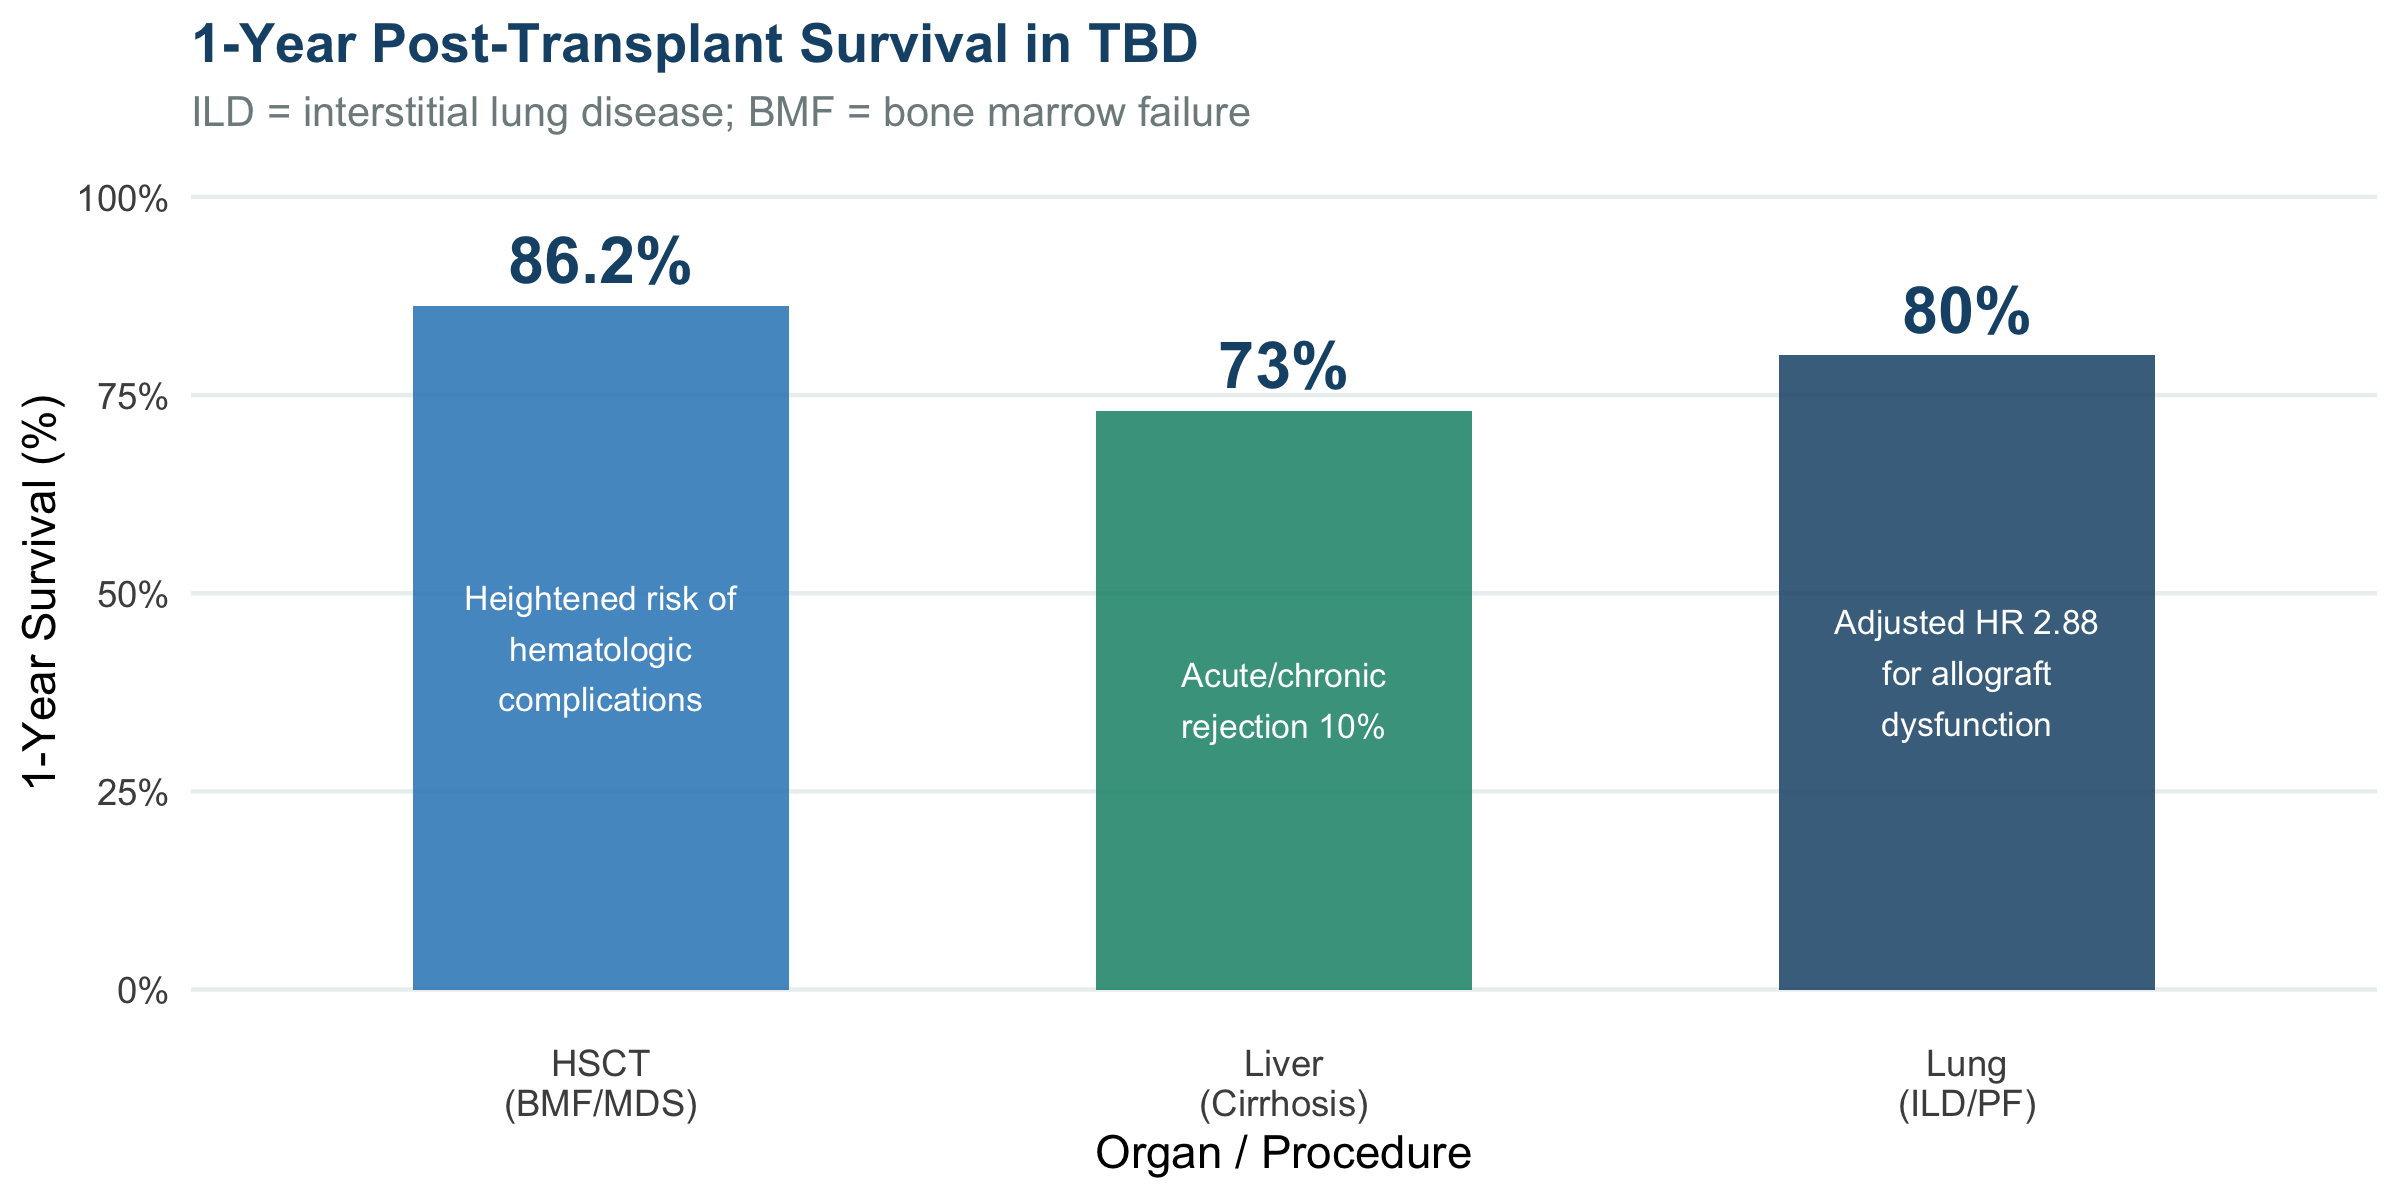
#| fig-cap: "One-year post-transplant survival rates across organ systems in TBD patients."
#| fig-height: 4
tx <- tibble(
Organ = c("Lung\n(ILD/PF)", "Liver\n(Cirrhosis)", "HSCT\n(BMF/MDS)"),
Surv = c(80, 73, 86.2),
Note = c("Adjusted HR 2.88\nfor allograft\ndysfunction",
"Acute/chronic\nrejection 10%",
"Heightened risk of\nhematologic\ncomplications"),
Fill = c(pal["blue1"], pal["teal"], pal["blue2"])
)
ggplot(tx, aes(x = Organ, y = Surv, fill = Organ)) +
geom_col(width = 0.55, alpha = 0.85, fill = tx$Fill) +
geom_text(aes(label = paste0(Surv, "%")),
vjust = -0.5, fontface = "bold", size = 5.5, colour = pal["blue1"]) +
geom_text(aes(label = Note, y = Surv / 2),
size = 2.85, colour = "white", lineheight = 1.25) +
scale_y_continuous(limits = c(0, 100),
labels = function(x) paste0(x, "%")) +
labs(
title = "1-Year Post-Transplant Survival in TBD",
subtitle = "ILD = interstitial lung disease; BMF = bone marrow failure",
x = "Organ / Procedure", y = "1-Year Survival (%)"
) +
theme_tbd() +
theme(
legend.position = "none",
panel.grid.major.x = element_blank()
)
```
---
# Screening Guidelines {.section-header}
<div class="screening-grid">
<div class="screen-card screen-heme">
<h4>🩸 Hematologic Monitoring</h4>
<ul>
<li>CBC at baseline and <strong>annually</strong> (more frequent if cytopenias)</li>
<li>Annual bone marrow aspirate + biopsy</li>
<li>Cytogenetics + NGS molecular genetics</li>
<li>Error-corrected sequencing for adaptive/maladaptive CH variants</li>
</ul>
</div>
<div class="screen-card screen-pulm">
<h4>🫁 Pulmonary</h4>
<ul>
<li>Annual pulmonary function testing from <strong>diagnosis</strong></li>
<li>Low threshold for HRCT chest</li>
<li>Pulmonology referral for any PFT decline</li>
</ul>
</div>
<div class="screen-card screen-liver">
<h4>🫀 Hepatic</h4>
<ul>
<li>Annual liver function tests</li>
<li><strong>MR elastography</strong> (preferred) or FibroScan</li>
<li>Evaluate for NRH and portal hypertension</li>
</ul>
</div>
<div class="screen-card screen-cancer">
<h4>🔍 Cancer Surveillance</h4>
<ul>
<li>Monthly self-exam (skin, breast)</li>
<li>Annual dermatologist skin cancer screen</li>
<li>Annual ENT: flexible laryngoscopy</li>
<li>Periodic gynecological / anogenital screen</li>
<li>Standard age-appropriate screening (breast, colon, prostate)</li>
</ul>
</div>
<div class="screen-card screen-bone">
<h4>🦴 Bone, Dental & Immunizations</h4>
<ul>
<li>Periodic DEXA for bone density</li>
<li>Routine dental screening</li>
<li>Ensure immunizations are current</li>
</ul>
</div>
<div class="screen-card screen-resource">
<h4>📚 Resources</h4>
<ul>
<li><a href="https://teamtelomere.org/diagnosis-management-guidelines/"><strong>Team Telomere</strong></a> — patient advocacy, education & financial support</li>
<li>Mayo Clinic TBD Clinic — multidisciplinary care</li>
</ul>
</div>
</div>
---
# Future Directions {.section-header}
<div class="future-grid">
<div class="future-card">
<div class="future-num">01</div>
<h4>ZSCAN4 Gene Therapy</h4>
<p>EXG34217 (Phase I/II, Cincinnati). Ex vivo telomere elongation in CD34⁺ HSPCs demonstrated; peripheral blood TL effect still under evaluation. (Myers et al., NEJM Evidence 2025)</p>
</div>
<div class="future-card">
<div class="future-num">02</div>
<h4>TINF2 CRISPR Editing</h4>
<p>Frameshift editing into HSPCs renders the faulty TINF2 allele ineffective, restoring TL and increasing proliferative capacity without transformation risk. (Choo et al., Blood 2022)</p>
</div>
<div class="future-card">
<div class="future-num">03</div>
<h4>PAPD5/7 Inhibition</h4>
<p>RG7834 restores TERC levels and TL in DKC1^A353V variant cells by inhibiting the PAPD5/7 polymerases involved in hTR degradation. (Shukla et al., Blood Adv. 2020)</p>
</div>
<div class="future-card">
<div class="future-num">04</div>
<h4>GSK3 Inhibition</h4>
<p>CHIR99021 enhances telomerase activity and corrects telomere dysfunction in iPSC-derived type II alveolar epithelial cells — relevant for TBD-associated PF. (Fernandez et al., eLife 2022)</p>
</div>
<div class="future-card">
<div class="future-num">05</div>
<h4>Nucleoside Supplementation</h4>
<p>Phase I (Boston Children's, NCT06817590): enteral deoxycytidine + deoxythymidine to elongate telomeres through nucleoside precursor availability.</p>
</div>
<div class="future-card">
<div class="future-num">06</div>
<h4>Low-dose Danazol (NIH)</h4>
<p>NCT03312400: recruiting TBD patients for 400 mg danazol to optimise dosing and balance telomere elongation against known adverse metabolic and endocrine effects.</p>
</div>
</div>
::: {.callout-important appearance="minimal"}
**Safety:** Any therapy causing unregulated telomerase reactivation risks oncogenesis —
TERT upregulation is present in ~90% of all human cancers. Gene-based therapies must
carefully balance telomere rescue with tumorigenic risk.
:::
---
# Summary Statistics {.section-header}
```{r}
#| label: fig-summary
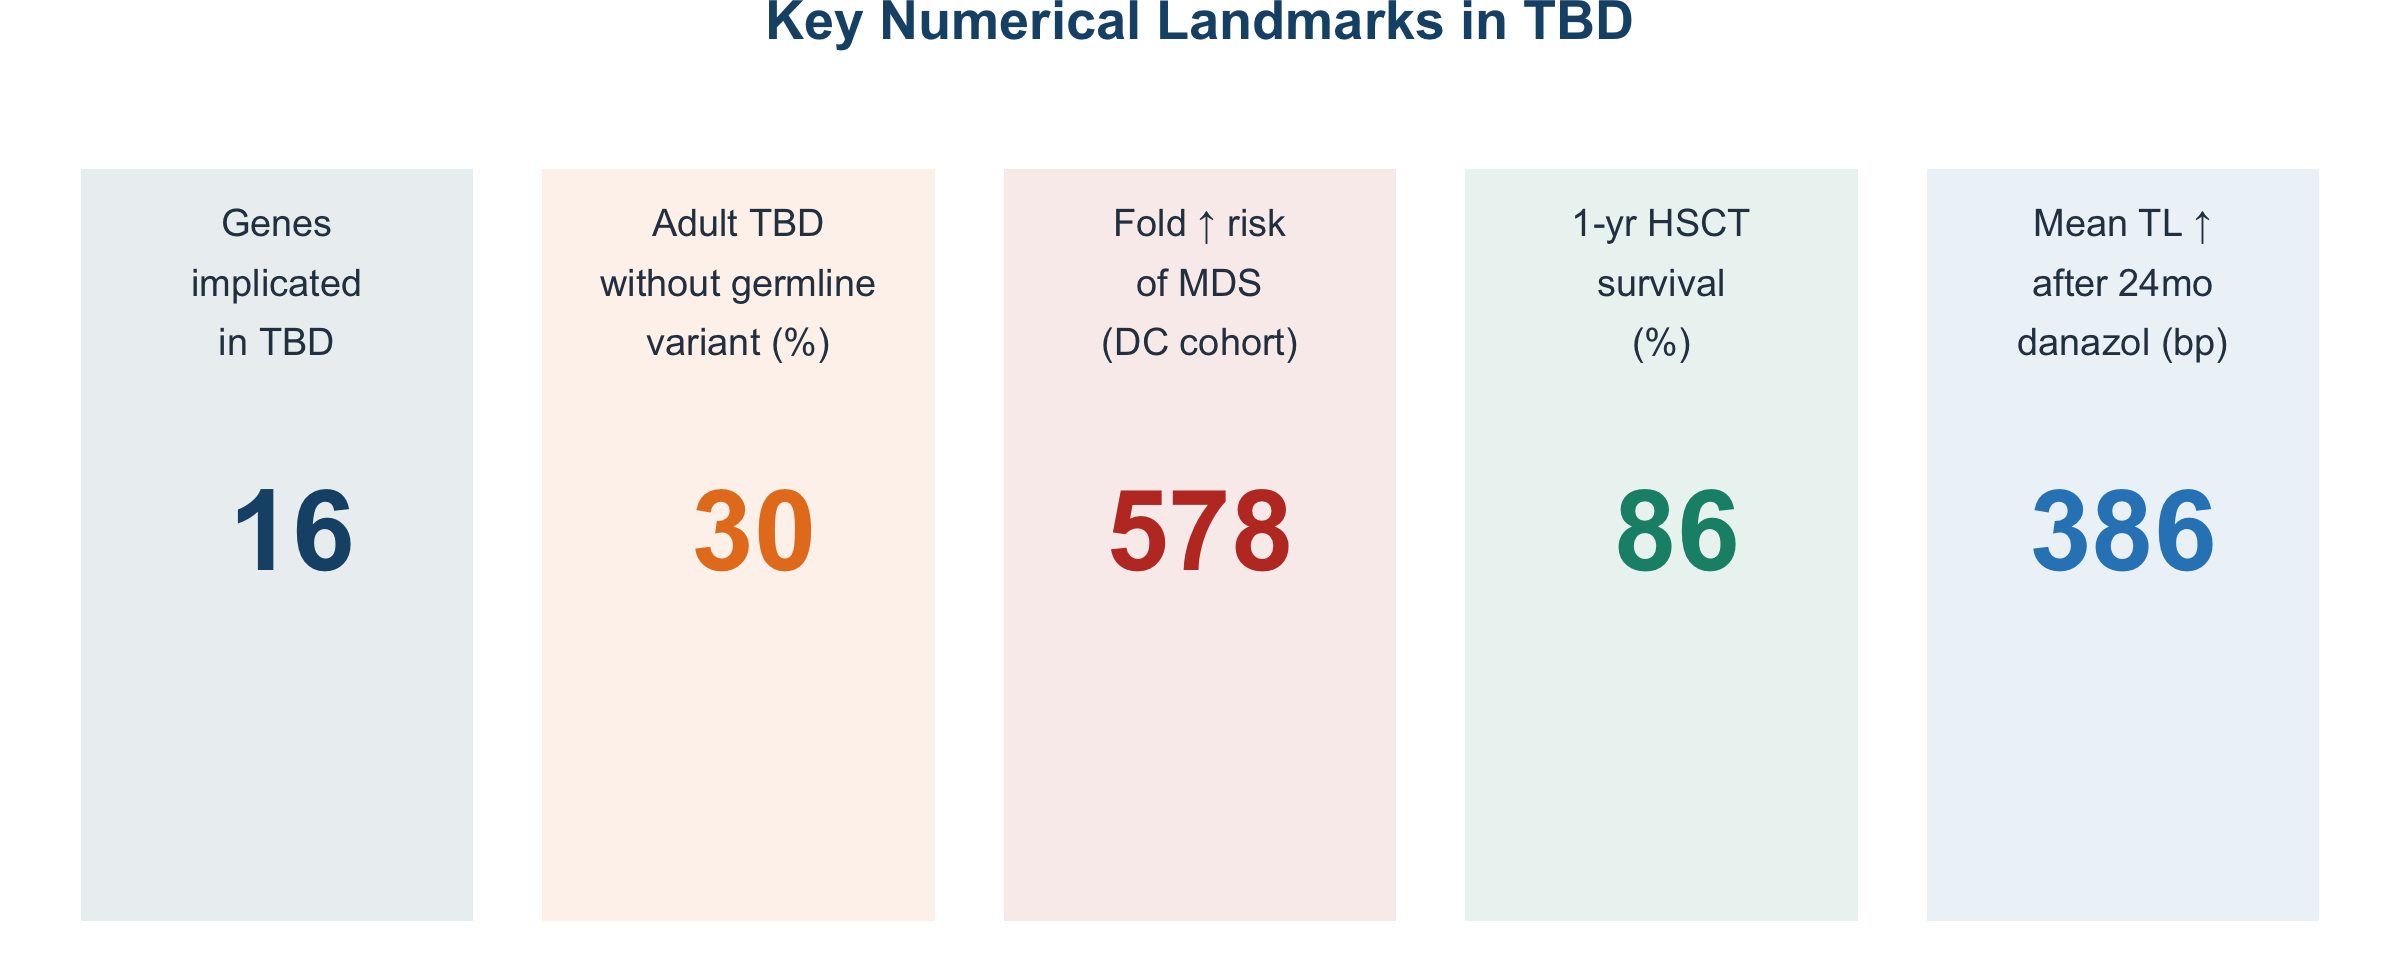
#| fig-cap: "Key numerical landmarks in TBD from this review."
#| fig-height: 3.2
stats <- tibble(
label = c("Genes\nimplicated\nin TBD",
"Adult TBD\nwithout germline\nvariant (%)",
"Fold ↑ risk\nof MDS\n(DC cohort)",
"1-yr HSCT\nsurvival\n(%)",
"Mean TL ↑\nafter 24mo\ndanazol (bp)"),
value = c(16, 30, 578, 86, 386),
colour = c(pal["blue1"], pal["orange"], pal["red"], pal["teal"], pal["blue2"])
)
ggplot(stats, aes(x = reorder(label, seq_len(nrow(stats))))) +
geom_col(aes(y = 1), fill = stats$colour, alpha = 0.1, width = 0.85) +
geom_text(aes(y = 0.52, label = format(value, big.mark = ",")),
size = 9.5, fontface = "bold", colour = stats$colour) +
geom_text(aes(y = 0.85, label = label),
size = 3.2, colour = "#2C3E50", lineheight = 1.3) +
scale_y_continuous(limits = c(0, 1.05)) +
labs(title = "Key Numerical Landmarks in TBD", x = NULL, y = NULL) +
theme_void() +
theme(
plot.title = element_text(face = "bold", size = 13,
colour = pal["blue1"], hjust = 0.5,
margin = margin(b = 10)),
plot.background = element_rect(fill = "white", colour = NA)
)
```
---
<div class="footer-box">
<p><strong>Source:</strong> Franke M, Ferrer A, Patnaik MM. "Diagnosis and management of adult
telomere biology disorders." <em>Haematologica</em> 111:797–812 (March 2026).
DOI: 10.3324/haematol.2025.287739</p>
<p>Rendered with Quarto | R + ggplot2 | `r R.version$major`.`r R.version$minor` |
`r format(Sys.Date(), "%B %Y")`</p>
</div>